P/E Ratio - A Quick Explanation

What’s a P/E Ratio?
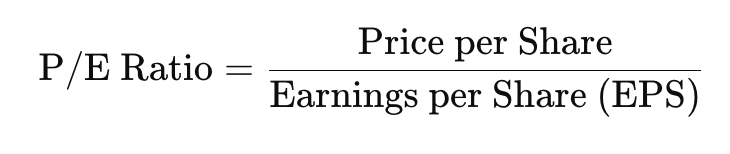
The P/E ratio is a simple but powerful metric investors use to gauge a company’s value. It’s calculated by dividing a company’s stock price per share by its earnings per share (EPS). For example, if a company’s stock is $50 and its EPS is $5, the P/E is 10. This means investors are willing to pay $10 for every $1 of earnings. Think of it as a price tag on profits—how much are you shelling out for a slice of the company’s income?
There are two flavors: trailing P/E (based on past earnings) and forward P/E (based on projected future earnings). Trailing is concrete but backward-looking; forward is speculative but future-focused. Investors often toggle between them depending on their vibe—historical stability or growth potential.
Why Do Banks Have Lower P/E Ratios Than Tech Companies?
Here’s the juicy part. Banks—like JPMorgan or Wells Fargo—often sport lower P/E ratios (say, 8-12) compared to tech giants like Apple or Tesla (where P/Es can soar past 30 or even 100). Why the gap?
- Growth Expectations: Tech companies are the market’s darlings because they promise explosive growth. Think AI, cloud computing, or electric vehicles—sectors with sky-high potential. Investors bet on future earnings skyrocketing, so they’re cool paying a premium now, inflating the P/E. Banks? They’re steady Eddies. They grow, but it’s more like a slow jog than a sprint—tied to interest rates, loans, and economic cycles.
- Risk and Volatility: Banks are tethered to the economy’s ups and downs. When recessions hit, loan defaults spike, and profits tank. Tech firms, while not immune, often have more diversified revenue (global sales, subscriptions) and less direct exposure to credit risk. Lower risk perception for tech can justify a higher P/E.
- Profit Margins: Tech companies often boast fat margins—software is cheap to scale once built. Banks, though, deal with thinner margins; they’re middlemen moving money, and regulations cap their wild side. Lower margins mean lower earnings relative to stock price, dragging down P/E.
- Market Sentiment: Wall Street loves a sexy story. Tech screams innovation; banks whisper stability. That hype gap shows up in the numbers—investors pile into tech, bidding up prices and P/Es, while banks get less love.
Why Does This Matter for Investing?
P/E isn’t just trivia—it’s a compass for your portfolio. A low P/E might signal a bargain (undervalued stock) or a red flag (stagnant growth). A high P/E could mean a growth rocket or an overpriced bubble. Context is king.
- Value Investing: If you’re a bargain hunter (think Warren Buffett), low P/E sectors like banks might catch your eye. You’re buying earnings on the cheap, betting on steady returns or a turnaround.
- Growth Investing: If you’re chasing the next big thing, high P/E tech stocks might be your jam. You’re banking on future profits, not today’s snapshot.
- Risk Management: P/E helps you weigh risk. A bank with a P/E of 10 might weather a storm better than a tech stock at 50—less room to fall if earnings disappoint.
The Bottom Line
P/E ratios are like a quick X-ray of a company’s market vibe—cheap or pricey, sleepy or sizzling. Banks lag in P/E because they’re reliable but not revolutionary; tech soars because it’s the future’s poster child. For investing, it’s a tool to match your style—value, growth, or balance. Just don’t treat it as gospel; pair it with other metrics (debt, cash flow) and a peek at the industry. That’s the scoop—now go make some smart moves!